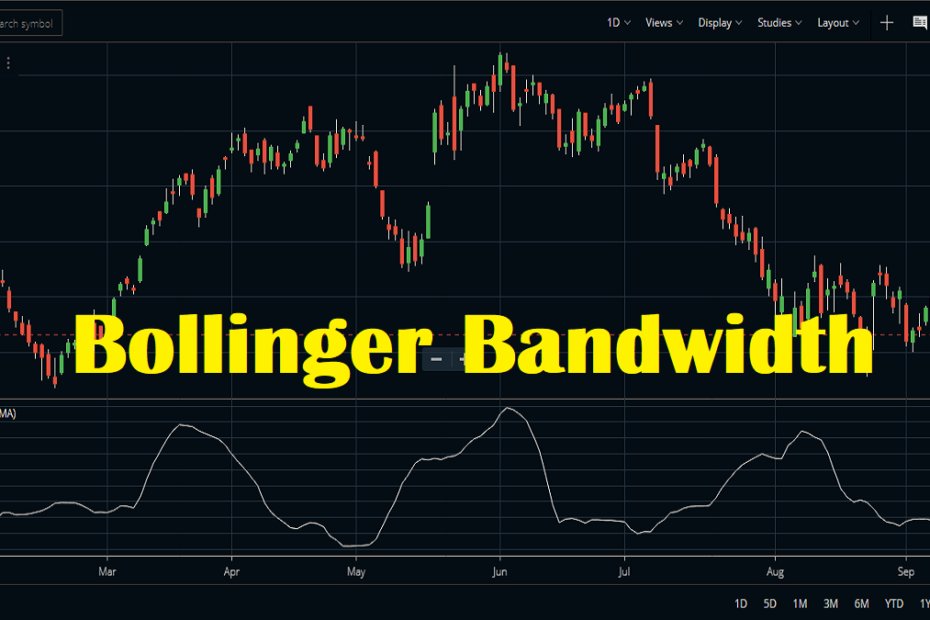
Learning to use the Bollinger band indicator like a pro trader

The Bollinger band indicator is one of the most effective tools for retail traders. Novice traders love to use this tool as it plots the important support and resistance level in the market. As you analyze the Bollinger band indicator, you should understand the functions of the upper and the lower band. The upper band acts as the resistance level and the lower band act as the support level. But these are your dynamic support and resistance level. To take the trades at the dynamic levels, you have to follow some strategic rules.
Though their many ways by which you can use the Bollinger band indicator, we are going to highlight the most prominent methods. After reading this article, you should be able to take an accurate reading from the Bollinger band indicator and make a decent profit without having much trouble.
Table of Contents
The slope of the Bollinger band
The slope of the Bollinger bands acts as the trend identifier. The slope of the band should be positive during an uptrend and it will turn negative during the downtrend. So, by analyzing the slope of the Bollinger band, you should be able to find the direction of the trend with a high level of precision. You can also consider the mid-band as the trend indicator instead of analyzing the slope of the channel. The direction of the mid-band indicates the prevailing momentum of the market.
Selection of the time frame
Usually, the rookie traders fail to analyze the Bollinger band indicator since they don’t know the proper way to select the time frame. They keep on analyzing the data in the lower time frame and faces frequent shifts in the trend. On the contrary, the professional traders at Saxo always evaluate the data in a higher time frame. Thus they don’t have to deal with the frequent changes in the trend and eventually they find the most reliable trade signals. So, use this indicator in the higher time frame to avoid the false reading.
Execution of the trades
The trades are executed at the upper and the lower band. But you should not place the trade without getting any price action confirmation signals. As the price hits the lower band of the indicator, you should be looking for the formation of the bullish candlestick. The bullish candlestick will give you the indication that the price is ready to move to a new high. On the contrary, you need a rejection of the upper Bollinger band to execute the short trades in the market. While taking the trades, try to avoid trading during the news hours as the market becomes extremely volatile.
Take profit
Determining the take profit with the help of the Bollinger band is a very simple task. Let’s say, you have taken the long trades at the Bollinger band support level. So, your target profit zone should be the upper band of the Bollinger band. Similarly, if you take the short trade at the upper Bollinger band, you should be setting the take profit price at the lower Bollinger band. By doing so, you will get a high risk to reward ratio trade setup most of the time.
Risk factor
After learning the basic use of the Bollinger band indicator, novice traders often start trading the market with high risk. But if you trade the market with high risk, you are not going to succeed as a retail trader. You will be losing money most of the time, and thus blowing up the trading account will be the ultimate result. So, try to trade the market with less than 1% risk at the initial stage. As you get skilled, you may increase the risk factor to two percent. Always be prepared to deal with the losing trades as it will make you more comfortable in the trade execution process and let you dynamically trade the market. Never expect that you can win every trade.


